
Introduction
Maps are pictorial representations of geographically referenced data (or geographic data) [Wikipedia: Accessed on 8 August 2021]. Maps help us with navigation (understanding the locations and their connections — site and situation), uncovering geographical patterns (geography question 1: Where is it?), understanding these patterns (geography question 2: Why is it there?), what are the consequences of these patterns (geography question 3: So what?), how can these patterns be changed (geography question 4: What if?).
Maps can be made on paper. However, paper maps have many limitations. To explore data in different ways immediately, interactive digital maps are better. The growing field of geo-informatics gives us many tools to make such interactive maps. Geo-informatics combines science and technology to visualize geographic data.
Using the 2021 Assembly Elections in Tamil Nadu (TN) as a case study, I will share with you a few interactive digital maps as examples of geo-informatics tools. Learning the various aspects of mapping can be a starting point for us to ask social science questions. Asking such questions can help us understand the subjects better.
Specifically, this essay helps us address the geography question 1 above.
In this context, applying the four geography questions becomes much more specific:
- Where have different parties prevailed or lost and by how many votes? (this essay addresses this question)
- Why did they prevail there?
- What are the consequences of the parties winning where they did?
- What could they do to serve the people?
How are maps made?
There are various ways to create and display maps. The tools available today are far more sophisticated and detailed than the ones used before.
The Babylonians were among the earliest makers of a world map [Wikipedia: Accessed on 16th July 2021]. They depicted the terrain around them. However, symbolism played a greater role in the depiction of their land over scientific methodologies. Their map showed a circular area surrounded by water bodies. This map fit their idea of the world, rather than being scientifically based.
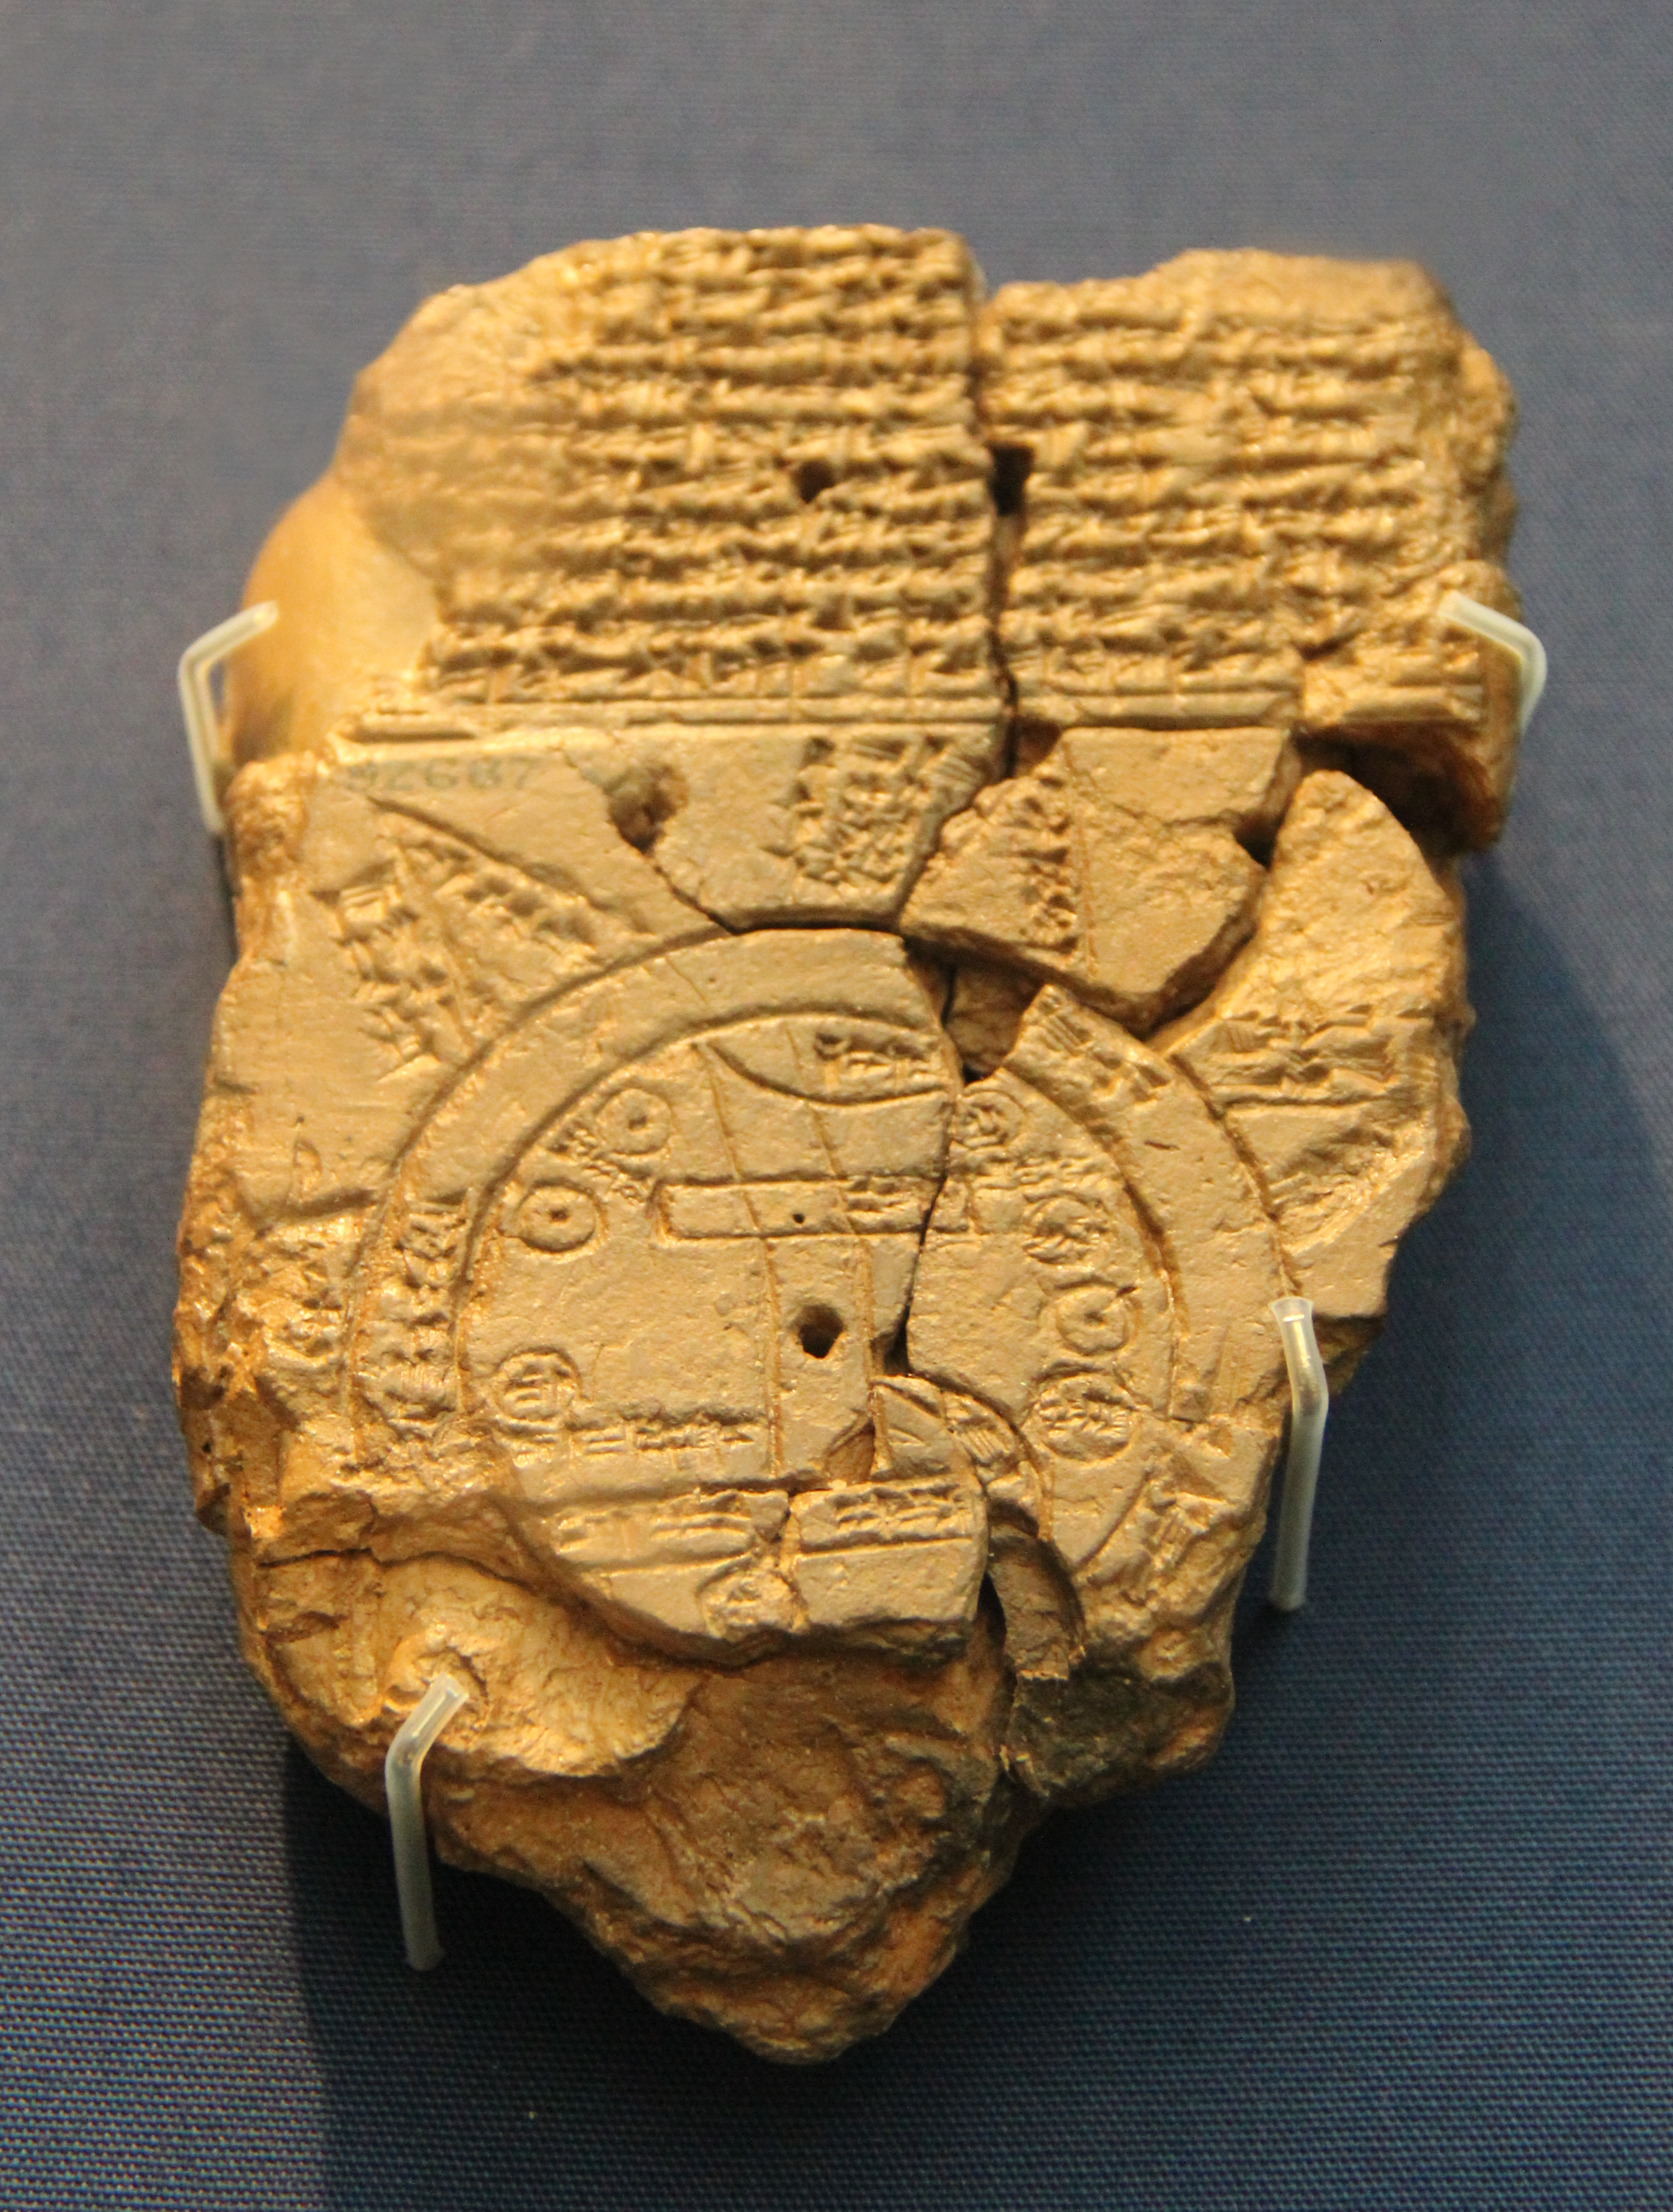
Babylonian map of the world. Source: Wikipedia. Click on the image to view a larger version (it will open in a new tab).
Today we have many tools such as Light Detection and Ranging (LIDAR), infrared cameras, satellites, etc. Using these, we are able to collect large amounts of data about many different aspects of Earth. These help us better view and understand our home planet.
The data derived using advanced tools are about places on Earth. Therefore, they are called geographically referenced data. These are represented on maps. Mapping the results of the TN 2021 elections is an example of the application of geography.
Mapping the 2021 Tamil Nadu Assembly Elections
I made four maps of the results of the 2021 TN assembly elections:
- Assembly constituency. This is the base map. A base map shows only boundaries. All the other data are put as layers on the base map.
- Winners. This map uses different colors to show where different parties won. I assigned a different color to each party for this. Such a map is called a choropleth map.
- Runners-up. This is also a choropleth map. It shows the party with the second largest number of votes
- Margin of winning. In elections we say one party won and others lost. The party with the second largest number of votes is the runner-up. Not all the wins are the same. In some cases the winner gets a very large majority of votes than the runner-up. In some cases the difference is not very big. The greater the margin of victory, the stronger the win is. Winning by a narrow margin shows less faith by the voters in the winner. Therefore, the margin of winning (or losing) is important to understand. This map shows the margin between the winner and the runner-up (the one with the next highest votes). I use different intensities of color to show this margin in this map.
In this project each map is treated as a layer. The first one serves as the base layer. These maps are interactive. If you wish to reset the maps, please reload the entire webpage.
Map #1 The Base Map
This map shows TN’s Assembly Constituencies (AC) and district boundaries. The election results are geographically referenced to the constituencies. We use this map as the basis to explore patterns of wins and losses in the 2021 TN Assembly election results.
You may notice a hierarchy of places in the map. India is a country. TN is one of its states. Within TN there are districts. Each district has several Assembly Constituencies . Each AC covers several talukas. Each taluka includes several villages (in cities there are municipal corporations). These maps deal with the AC.
Explore (using the zoom in/out feature in the map):
- Districts where assembly constituencies are most densely packed. Name them.
- What is common to these locations?
Map # 2 Map of winners
This map shows all the constituencies coloured according to which party won where. This map shows general trends in the voting.
Explore:
- Looking at this map, are you able to make out if there is any pattern to the ACs where different parties have won? If yes, describe the pattern.
- Identify three constituencies that are neither won by DMK or AIADMK
NOTE: If you do find a pattern and describe it, you will likely be creating regions in TN.
Map #3 Map of runners-up
This map shows the runner-up party in each AC.
Explore:
- In most ACs where the DMK won, AIADMK is the runner-up (i.e., has the next highest number of votes). What does this pattern suggest?
- Is this pattern the same throughout TN?
- If “no”, identify AC where the pattern is different.
- Which are the main parties in those AC?
Map #4 Winning Percentage Map
Map #4 shows the margin by which the winner and runner-up are separated.
Explore:
- Can you make out any patterns of how wide the gaps are between the winner and runner-up parties across the state?
- If yes, what is that pattern?
Conclusion
I started this essay with the four questions of geography:
- Where is something?
- Why is it there?
- So what?
- What if?
In this essay, I explored the first question to look at voting patterns in TN’s 2021 Assembly Elections using online maps.
I chose online maps because they allow us to explore data easily and immediately. Paper maps don’t. Online maps can be easily shared with others within seconds.
Geoinformatics is a rapidly growing field. I hope this essay has made you more curious to explore it further.
In my next essay, I will show you how I made these maps.
Acknowledgements:
Thanks to the following for help with this project:
- Sri Arun Ganesh (Twitter: @planemad)
- Dr Chandra Shekhar Balachandran (Twitter: @GeoVidyaa)
- Sri Gurudatta K N
- Smt Jyothi
- Sri Raj Bhagat (Twitter: @rajbhagatt)
About the author:
I am a homeschooler living in Chennai. I joined The Institute of Geographical Studies (TIGS) as a student under the Geography.over.Distance (G.o.D.) program in 2015. After my first experience at the International Geography Youth Summit (IGYS), I started to volunteer at TIGS. Computers being my field of passion I decided that it would be best if I engage more with the technical team of TIGS.
Featured image: Winner margin map of TN 2021 Assembly Elections. [Source: Author]
No responses yet